black and white bed linen

Transform Data Insights

Empowering smarter business decisions through expert analytics and customized tracking solutions for your growth.

Data Intelligence Services

Empowering businesses with actionable insights through advanced data analytics and custom tracking solutions.

Brand Performance Analysis
A digital chart display featuring a green line graph against a dark background, with data units labeled in white text. The line graph suggests an analysis of data volume, with sharp peaks and valleys. The lower portion of the graph is highlighted in red, indicating critical data points or alerts.

In-depth analysis tailored to your sector for enhanced brand performance and market positioning.

A digital dashboard displays metrics related to web performance. Graphs show detailed statistics such as total clicks, total impressions, average click-through rate (CTR), and average position over time. The chart utilizes various colors to distinguish different data sets, and the interface features tabs labeled 'QUERIES', 'PAGES', 'COUNTRIES', 'DEVICES', and 'SEARCH APPEARANCE'.
A laptop displaying a dashboard with various graphs, charts, and numeric data. The screen is partially visible, showcasing sections with line graphs, financial figures, and small images. The background is blurred with a prominent red light creating a warm ambiance.
Digital Tracking Systems

Comprehensive implementation of tracking systems to monitor user behavior and engagement effectively.

Advanced Reporting Insights

Delivering growth insights through sophisticated reporting and analytics for informed decision-making.

Data Insights

Transforming raw data into actionable insights for business growth.

An iPad displaying data visualization content next to a book titled 'Data Science for Business.' The iPad is showing notes and a diagram about dashboard design, accompanied by a stylus placed between the iPad and the book.
Performance Analysis

We provide sector-specific brand performance analysis to enhance decision-making and drive profitability for businesses across various industries through precise data intelligence.
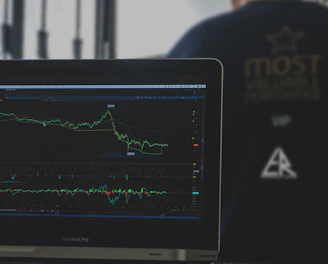
A laptop displays a detailed financial chart with lines showing data trends. In the background, a person is partially visible, wearing a dark shirt with the words 'most valuable' and some logos printed on it. The setting appears to be a modern workspace.
Tracking Solutions

Our end-to-end digital tracking system implementation ensures comprehensive user behavior tracking, delivering advanced reporting and custom dashboards tailored to your business needs.